How It Works Solutions Tools Resources Blog Pricing Apply as Design Partner
Working prototype validated. Help shape the commercial release. Apply as Design Partner →
Prototype-Validated Architecture

The Mathematical Operating Model Behind Guidance

The original Guidance prototype validated a six-layer model for CPG costing, cost propagation, confidence scoring, and channel-margin analysis. We are now rebuilding that architecture into a secure commercial platform. The capabilities described below are product design and rebuild scope, not a claim of general availability today.

Apply as Design Partner
The Problem

Why CPG Math Is Broken Without the Right Engine

A CPG brand selling through UNFI, Amazon, and its own DTC store is not running one business, it is running three different margin structures simultaneously. Each channel has its own deductions, fees, freight costs, and promotional allowances. Each production run has its own yield variance. Each ingredient has its own price history and tariff exposure.

Most brands track this in Excel. Some use QuickBooks. A few use ERPs built for discrete manufacturing, not food. The result is the same in every case: COGS is always slightly wrong, margins are always slightly off, and nobody knows by exactly how much.

Guidance was created to solve this problem with a purpose-built computational model rather than another disconnected spreadsheet. The prototype validated the approach; the production implementation is now in commercial rebuild.


The Architecture

Six Layers. One Source of Truth.

The Guidance architecture is organized into six sequential layers. Each layer takes the output of the previous one as its input. In the commercial design, this produces a connected calculation path from raw ingredient cost to channel-level margin, with confidence attached to every material input.
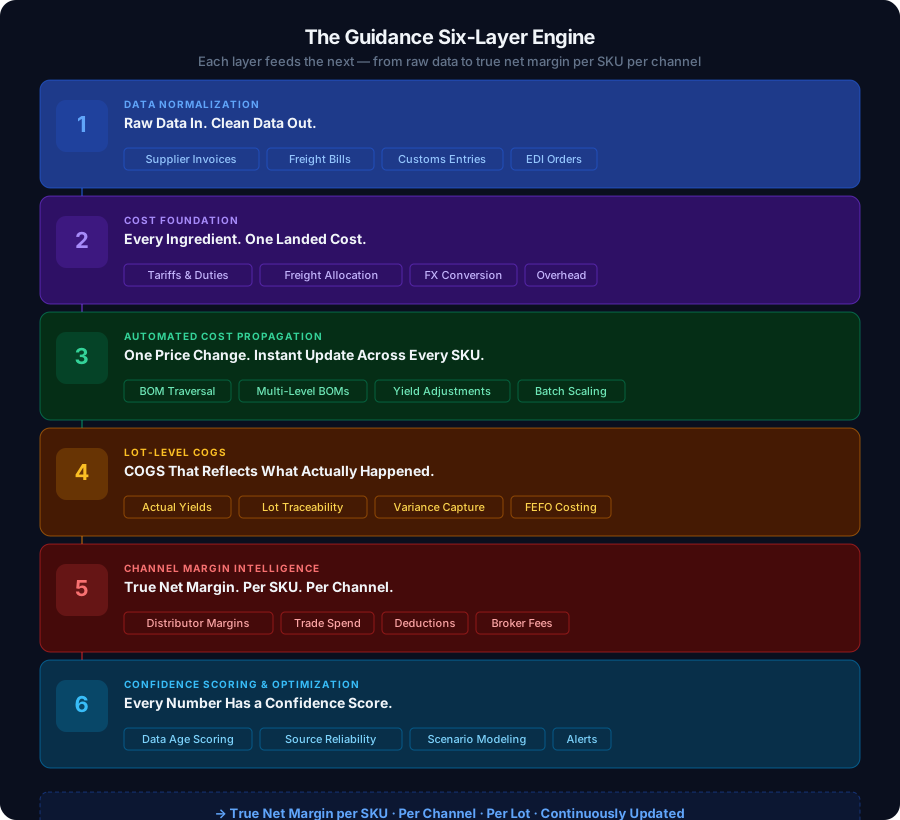
The Guidance Six-Layer Engine, architecture diagram showing all 6 layers from data normalization to confidence scoring
1
Data Normalization

Raw Data In. Clean Data Out.

Before any math can happen, the data has to be clean. The commercial design is intended to ingest supplier invoices, distributor remittance files, production records, and sales data and normalize them into a unified internal format.

The intended scope includes distributor deduction normalization. UNFI, KeHE, and other distributors use different taxonomies for deductions such as spoils, MCB, OI, EDLC, and scan-backs. The commercial design is meant to map those records to a common taxonomy so deductions can be categorized and attributed to the relevant SKU and promotion.

Supplier invoice parsing Distributor deduction normalization Unit of measure conversion Lot number reconciliation
2
Cost Foundation

Every Ingredient. Every Overhead. One Landed Cost.

The cost-foundation design is intended to calculate landed cost for ingredients and packaging components, including invoice price, freight, duty, tariffs, and applicable Section 301 surcharges.

The intended commercial workflow connects lot-level cost records to production usage so differently priced receipts can be attributed to the relevant batch rather than averaged together.

Landed cost calculation Tariff & duty allocation Lot-level cost tracking Overhead absorption Section 263A UNICAP
3
Automated Cost Propagation

One Price Change. Connected Updates Across Every SKU.

The prototype validated the underlying cost-propagation model. The commercial design is being rebuilt so an ingredient price change can flow through connected BOMs and identify the COGS impact on affected SKUs.

The intended result is a controlled propagation workflow that reduces disconnected spreadsheet updates and makes the effect of a reformulation or price change visible before it becomes a margin surprise.

Multi-level BOM propagation is part of the commercial rebuild scope so a component-cost change can flow through sub-assemblies to affected finished goods.

Commercial scope: cost propagation Multi-level BOM support Yield variance adjustment Reformulation tracking
4
Lot-Level COGS

COGS That Reflects What Actually Happened in Production.

Standard COGS calculations reflect what a team expected to spend. The commercial design is intended to calculate lot-level actual COGS using production evidence such as yield variance, rework, waste, and recorded deviations.

In the intended workflow, a 94% actual yield versus a 97% expected yield would change the attributed cost for that lot. Deviation detection and historical yield ranges remain commercial rebuild scope rather than generally available functionality.

Actual vs. standard cost variance Yield variance tracking Lot-level COGS attribution Production deviation flagging
5
Channel Margin Intelligence

True Net Margin. Per SKU. Per Channel. After Everything.

COGS is only half the picture. What a brand actually keeps depends on which channel the product was sold through. A unit sold through UNFI has a completely different net margin than the same unit sold DTC or on Amazon, because each channel has its own deductions, fees, freight costs, and promotional allowances.

The channel-margin design is intended to combine SKU cost with channel-specific deductions and fees, including distributor deductions, Amazon fees, and DTC transaction and fulfillment costs. This remains commercial rebuild scope; integrations and production reconciliation are not yet generally available.

UNFI / KeHE deduction categorization Amazon FBA & referral fee calculation DTC margin calculation Trade spend attribution Broker commission tracking
6
Confidence Scoring & Optimization

Every Number Comes With a Grade.

The prototype validated a Confidence Score model from 0 to 100 for distinguishing confirmed inputs from estimates and missing data. The commercial rebuild is intended to preserve that evidence trail across costing and margin calculations.

This matters because CPG teams routinely make decisions with incomplete data. The intended model shows which inputs are confirmed and which require review before a pricing or channel-allocation decision.

The planned optimization layer would use confidence-scored data to surface potential margin deterioration, channel underperformance, and scenarios for price or allocation changes. These recommendation workflows are not yet generally available.

Data freshness scoring Confidence-weighted reporting Margin deterioration alerts Channel optimization recommendations Scenario simulation

Why It Matters

What This Means in Practice

The six-layer architecture addresses specific mathematical problems in CPG operations. The examples below describe the intended behavior of the commercial design, informed by the working prototype; they are not claims of current general availability.

Ingredient price changes can flow through connected costs.

The commercial design is intended to show how a supplier price change affects connected BOMs and relevant SKU costs. Production timing and automation behavior will be validated through design-partner pilots.

Lot-level traceability connected to costing.

The intended model connects lot identity, production usage, and cost attribution so recall and costing records can share the same operational evidence. Production traceability workflows are still in commercial rebuild.

Channel margin designed around deduction evidence.

The planned channel-margin workflow is designed to reconcile distributor deductions and fees against transaction evidence. Distributor integrations and production reconciliation are not yet live.

Confidence scores distinguish evidence from estimates.

The prototype validated a model for showing which inputs are confirmed, estimated, or missing. The production implementation is being rebuilt for commercial use.

Scenario simulation is part of the planned scope.

The commercial roadmap includes modeling tariff, reformulation, channel, and pricing scenarios before a team commits to a change. Exact workflow and availability will be validated with design partners.

Designed around co-packer relationships.

The commercial scope is intended to model variable yields, toll-processing fees, ownership of materials, and production across facilities. These co-manufacturing workflows are still being rebuilt and validated.


How We Compare

Target Commercial Design vs. Common Alternatives

Most CPG brands use spreadsheets, QuickBooks, or a general-purpose ERP for these calculations. The Guidance column describes prototype evidence or intended commercial scope, not functionality that is generally available today.

Capability Spreadsheets QuickBooks Generic ERP Guidance status
Automated cost propagation ✗ Manual ✗ Manual ✗ Manual Commercial design
Lot-level COGS (actual vs. standard) Partial Planned scope
Distributor deduction categorization Planned scope
True net margin by channel ✗ Estimate only Commercial design
Confidence scoring on calculations Prototype-validated model
Scenario simulation Manual copy Limited Planned scope
Tariff & duty impact on COGS Commercial design
Co-packer yield variance tracking Partial Planned scope

Go Deeper

Learn More About the Math

Each layer has a dedicated article explaining the underlying concepts, the formulas operators need to understand, and how the Guidance commercial design is intended to approach the problem.

Layer 3
What Is Automated Cost Propagation and Why CPG Brands Need It
Layer 5
True Net Margin by Channel: The Math Every CPG Brand Needs
Layer 6
Confidence Scoring: Why Your COGS Might Be Wrong Right Now
Layer 1
UNFI Deduction Codes Explained: Every Code, What It Means, How to Dispute
Layer 6
How to Simulate a Tariff Increase Before It Hits Your Margins
Foundation
How to Calculate COGS for a Food Brand: Formula, Examples & Common Mistakes

Help Validate the Commercial Rebuild

Apply to be a design partner for early access. We are onboarding a small group of CPG brands to work directly with the team and shape the product.

Apply as a Design Partner